Interfacing a VNA using LAN with Python
Sohum Suthar | Lee Teng @ APS @ Argonne National Laboratory
Initial Setup (PC)
Initially, it is necessary to install the required driver support for the Vector Network Analyzer (VNA). The R&S ZVA-24 can be interfaced using NI-VISA (National Instruments Virtual Instrument Software Architecture) through the NI MAX (Measurement & Automation Explorer) software or similar software such as R&S VISA (link to docs).
Install NI MAX
- Download the package from the NI System Configuration webpage or by using NI Package Manager and searching for "NI System Configuration" in the Browse Products tab.
- Run the downloaded executable file.
- Check the "NI Measurement & Automation Explorer" box and proceed with the installation.
- Restart your computer to complete the installation.
Note: NI MAX is included with all NI drivers such as NI-VISA.
For more information on how to correctly install NI VISA, please refer to the documentation provided by National Instruments.
Physical LAN Connection
To connect the ZVA-24 Vector Network Analyzer to your Windows computer via LAN, follow these steps:
- Connect a LAN/ethernet cable to one of the LAN ports on the rear panel of the analyzer.
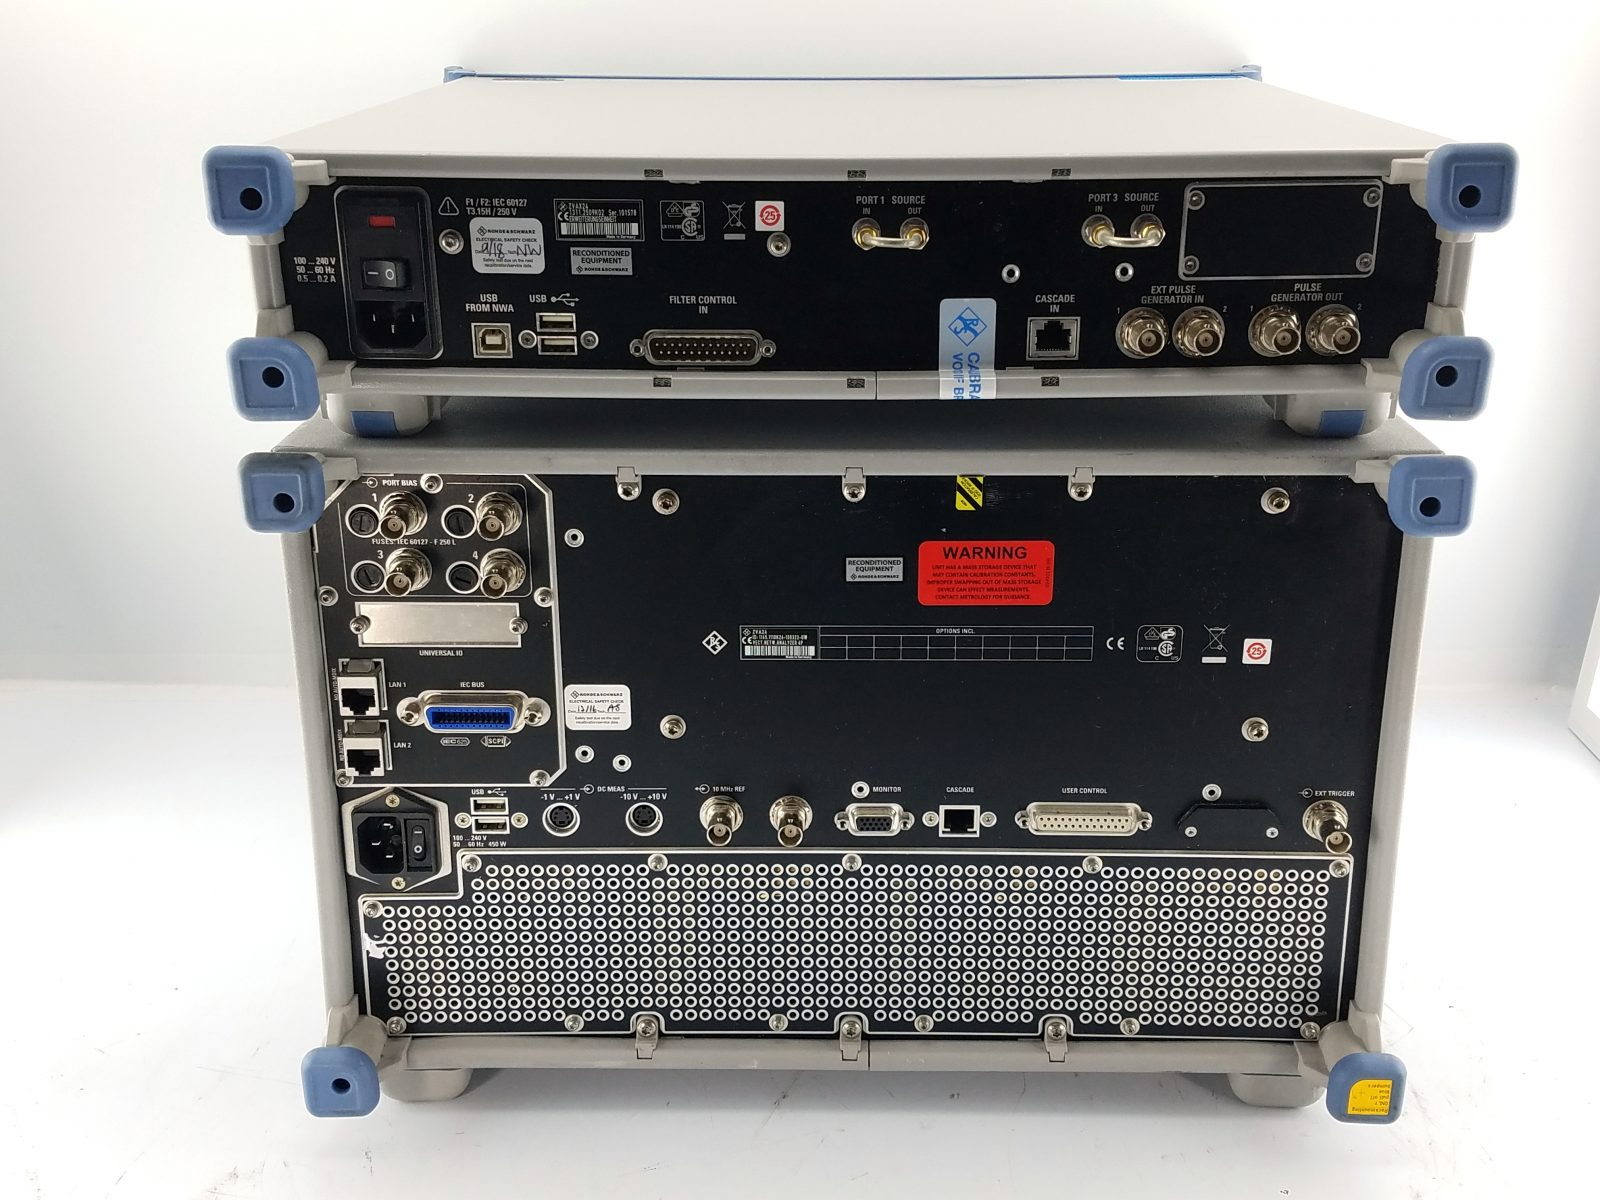
- Ensure that the LAN ports of the analyzer are auto-crossover Ethernet ports, which can be connected directly to a computer or another test instrument.
TCP/IP Configuration
The LAN TCP/IP configuration for the analyzer can be obtained in different ways depending on the network capacities.
- If the network supports dynamic TCP/IP configuration using DHCP (Dynamic Host Configuration Protocol), the configuration can be assigned automatically.
- If the network does not support DHCP or if the analyzer is set to use alternate TCP/IP configuration, the configuration must be entered manually.
- By default, the analyzer is configured to use dynamic TCP/IP, so it is safe to establish a physical connection to the LAN without any previous analyzer configuration.
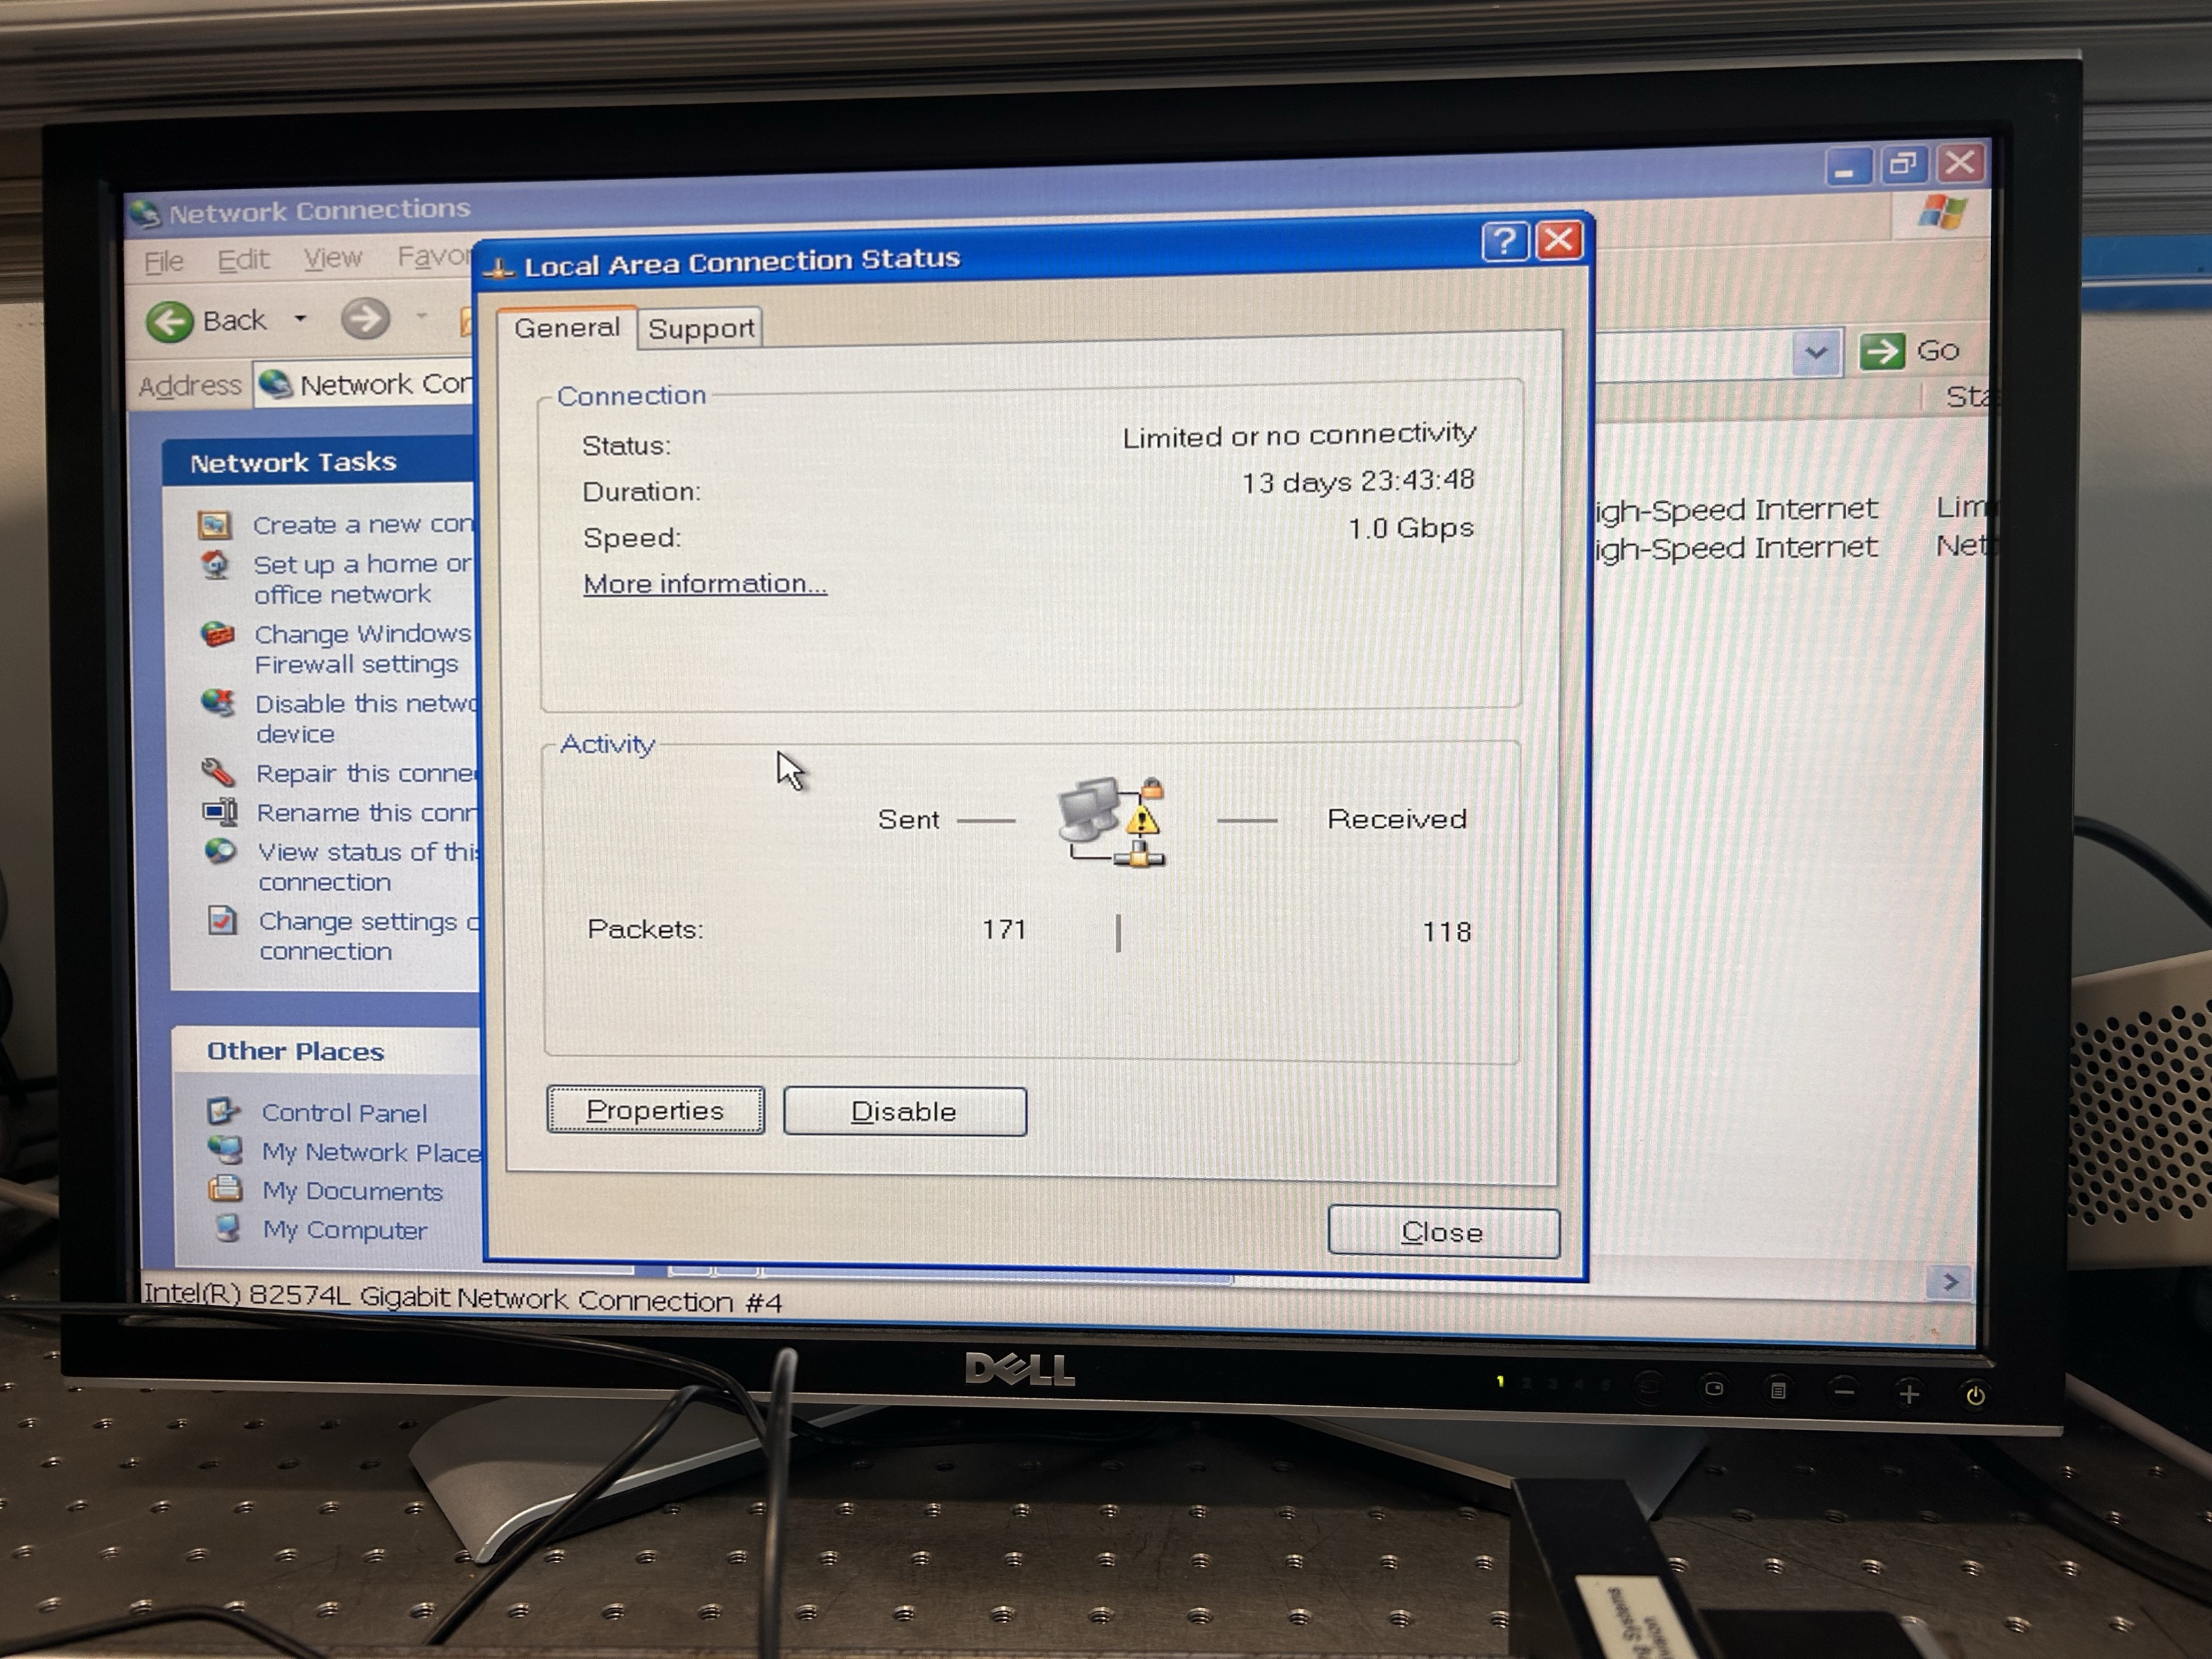
Finding your IP
On your VNA, open the command prompt and run the command:
ipconfig
The output will be similar to the following:
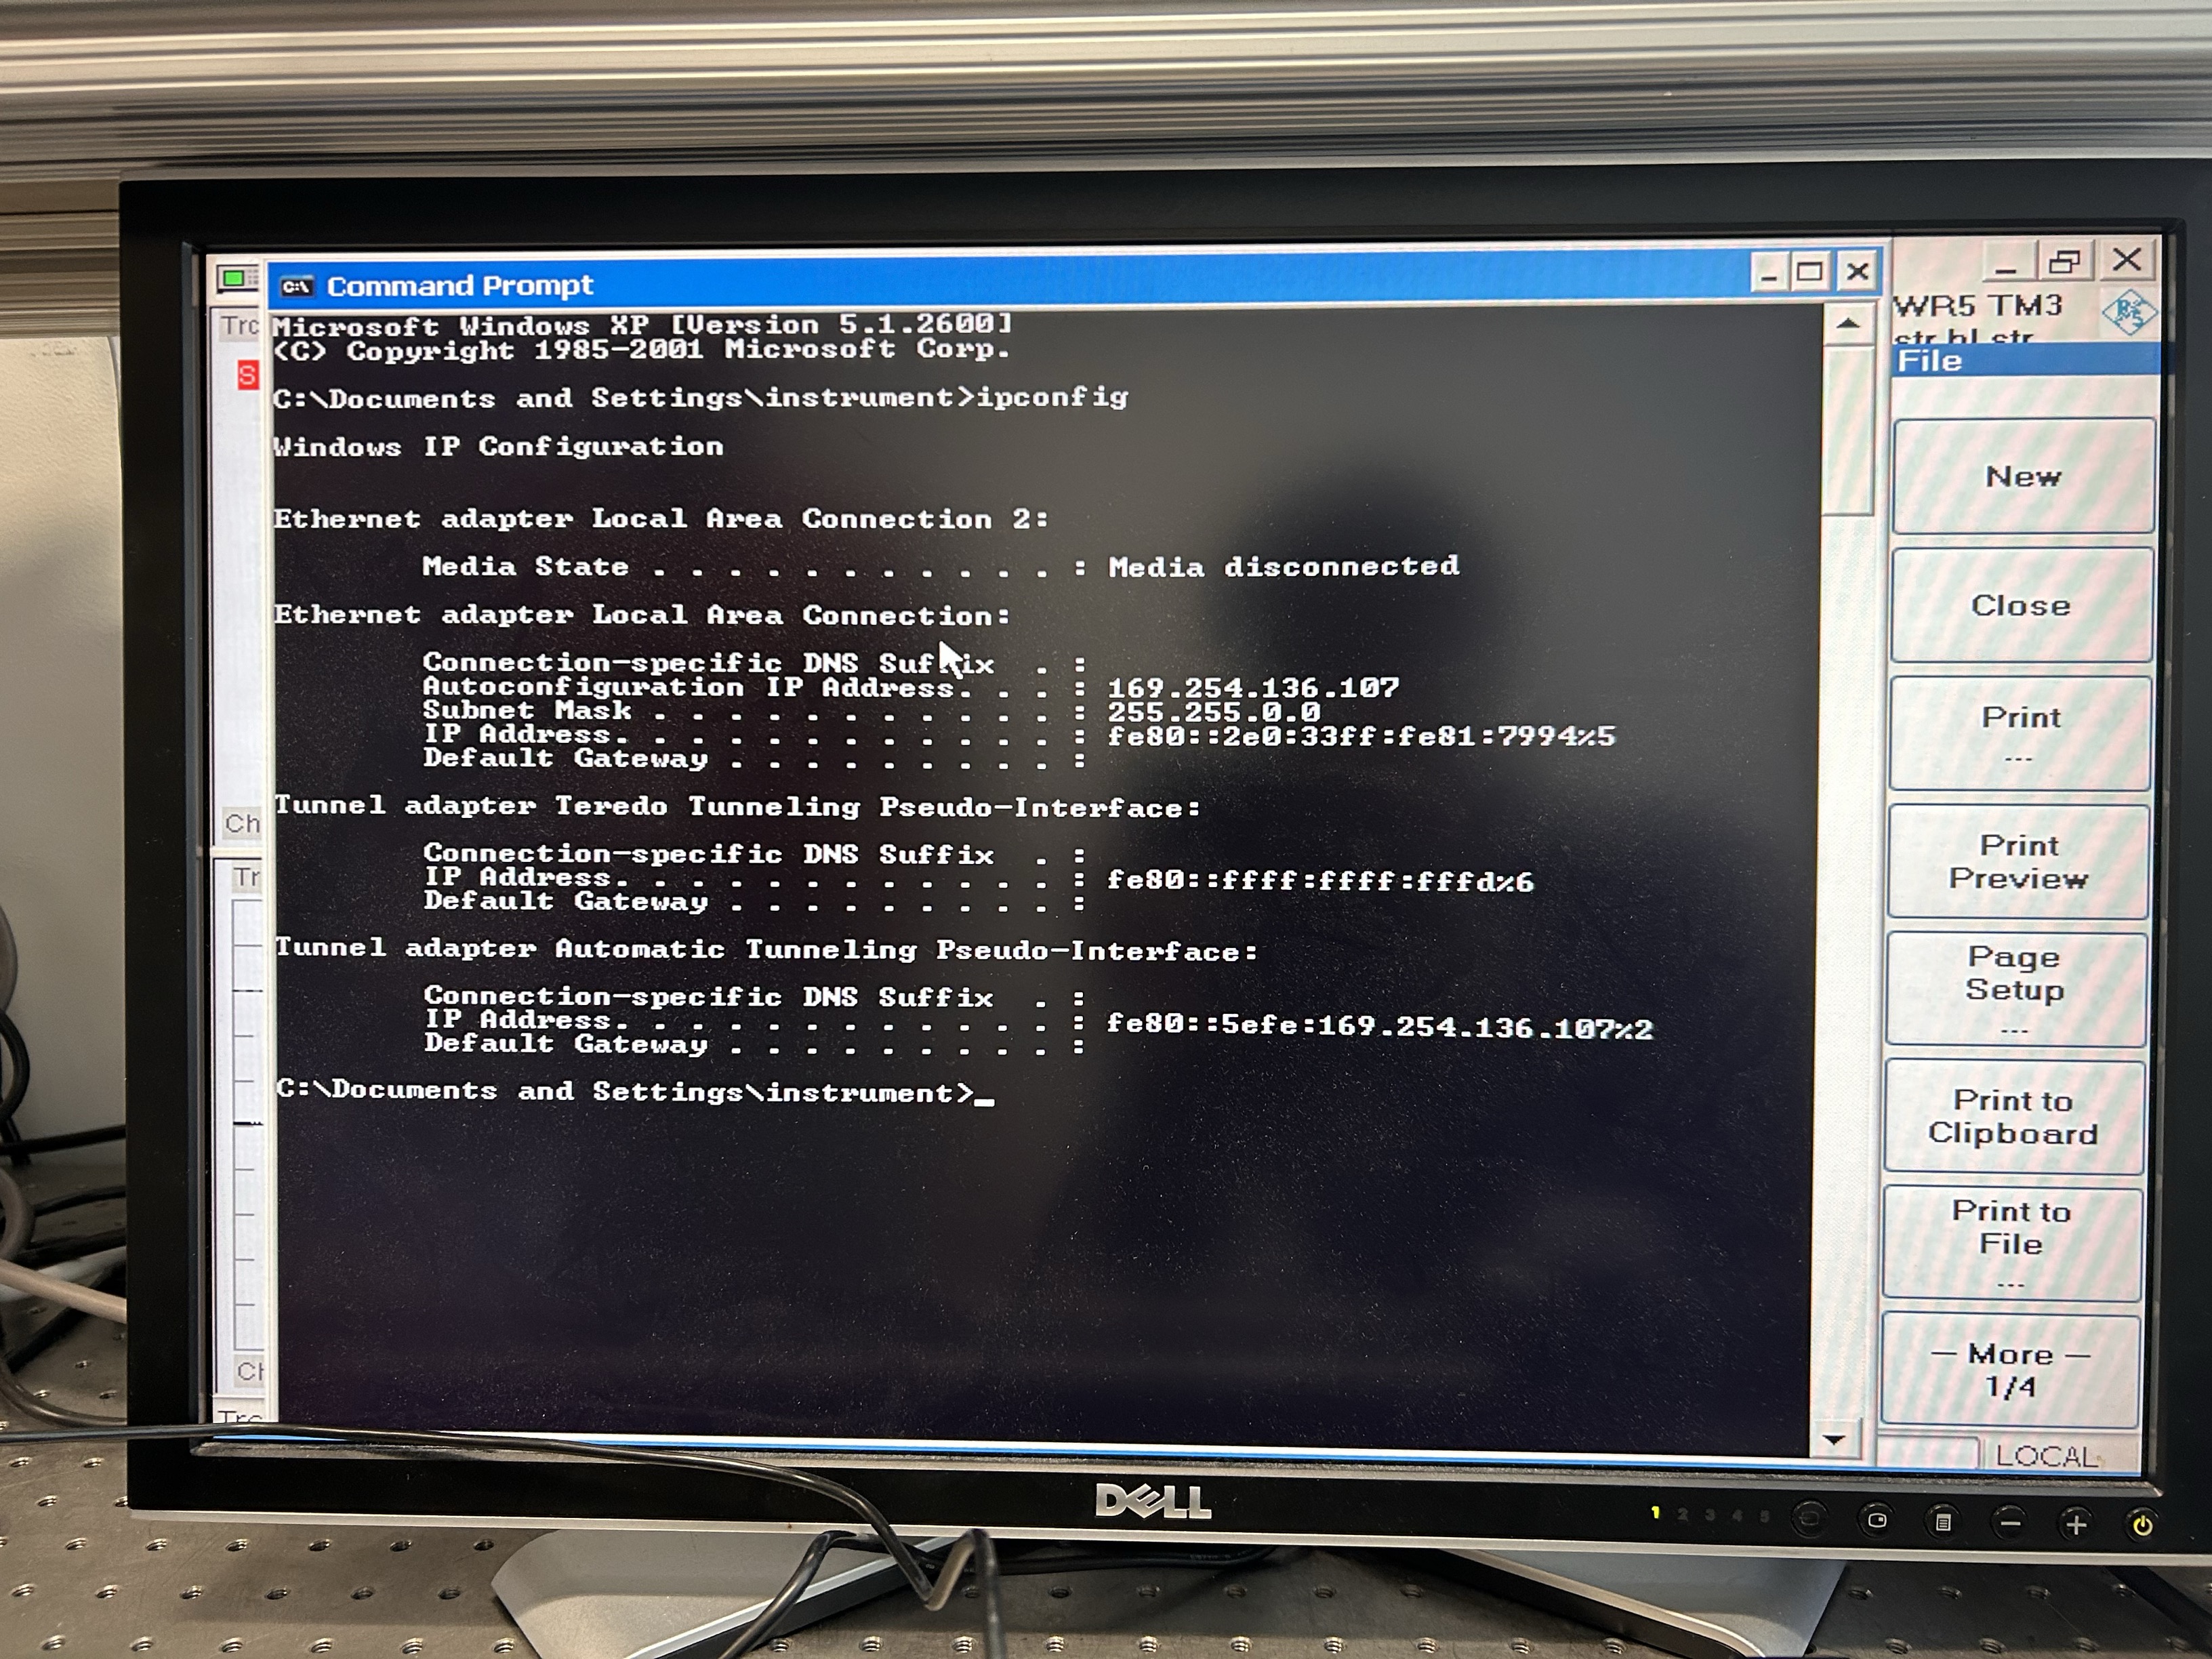
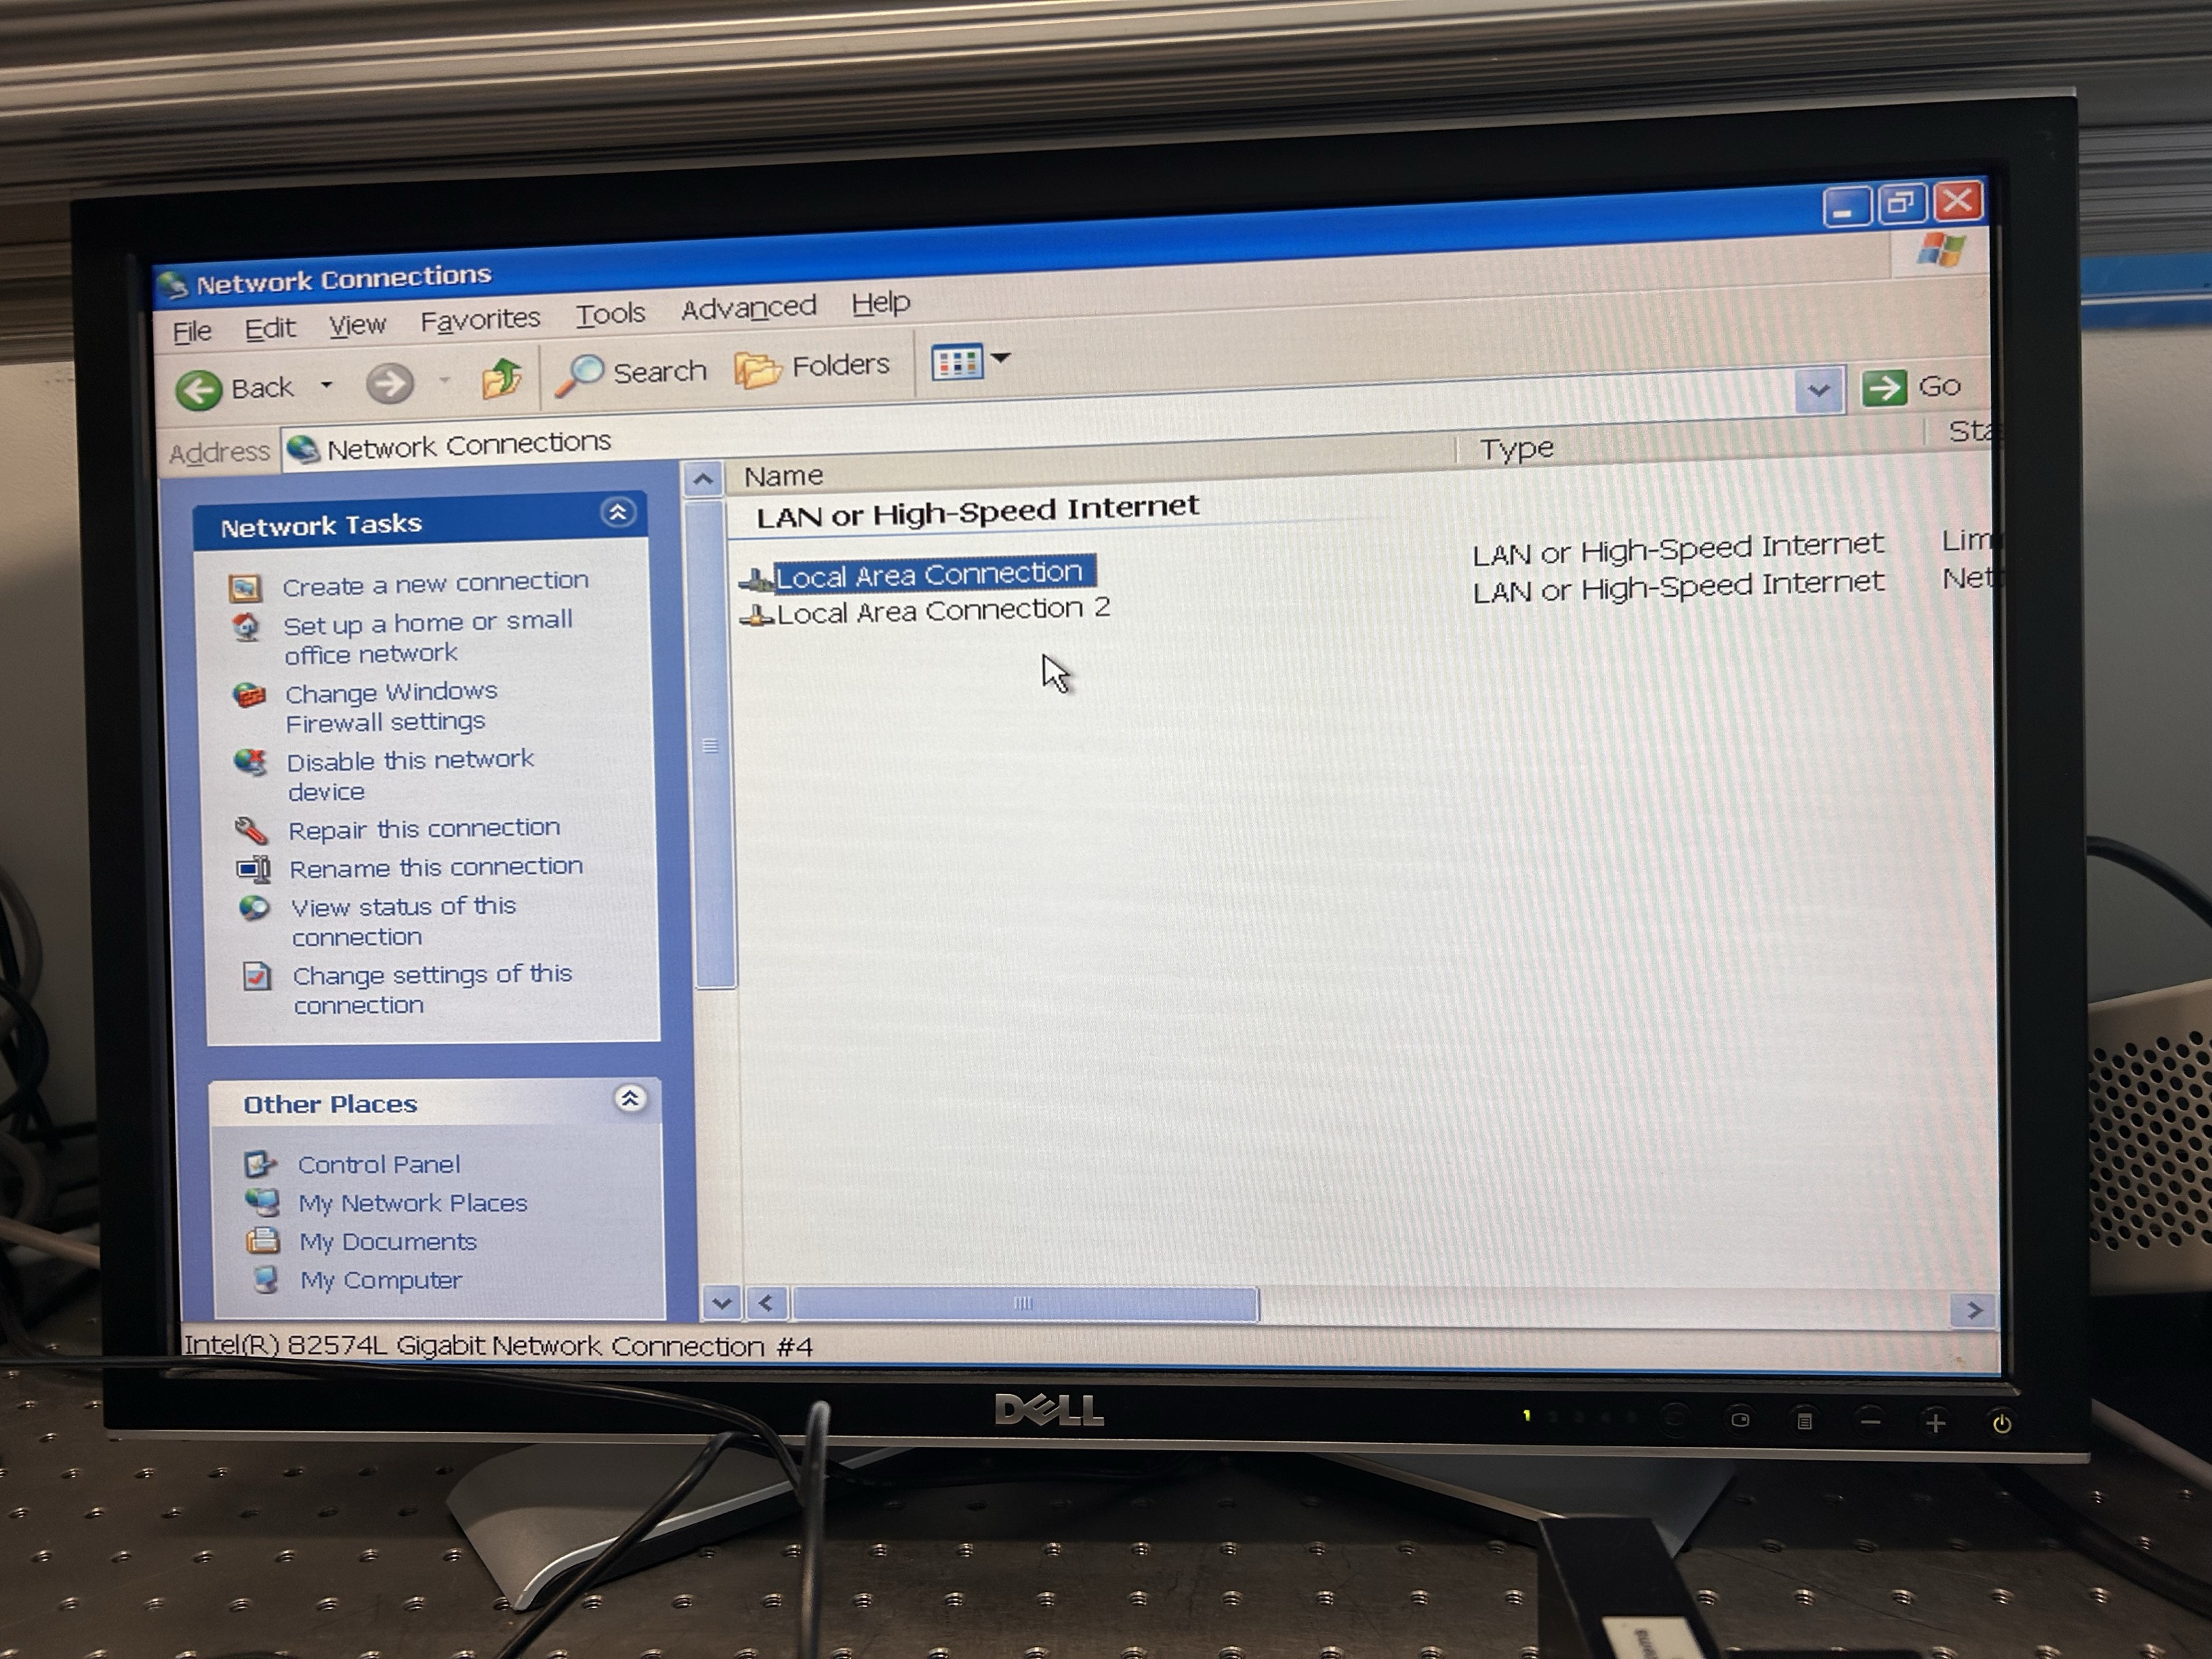
Look for the “Ethernet adapter Local Area Connection” IP address.
Note: If your network does not support DHCP or if you choose to disable dynamic TCP/IP configuration, you must enter a valid TCP/IP configuration before connecting the analyzer to the LAN.
Host Configuration
Using NI MAX to Connect the ZVA-24 to the Windows Computer:
- Install NI MAX:
Ensure that you have NI MAX (Measurement & Automation Explorer) installed on your computer.
- Open NI MAX:
Launch NI MAX from your Start menu
Create a New VISA TCP/IP Resource:
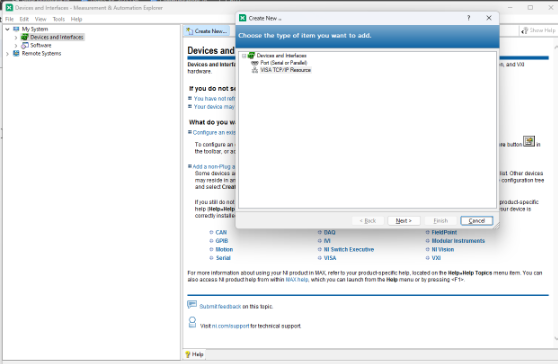
In NI MAX, right-click on "Devices and Interfaces" and select "Create New..."
Choose "VISA TCP/IP Resource" from the list of options.
- Manual Entry of LAN Instrument:
Select "Manual entry of LAN Instrument."
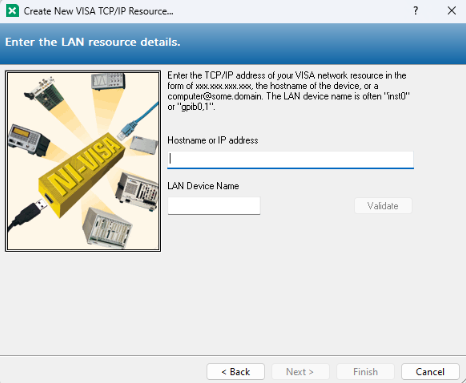
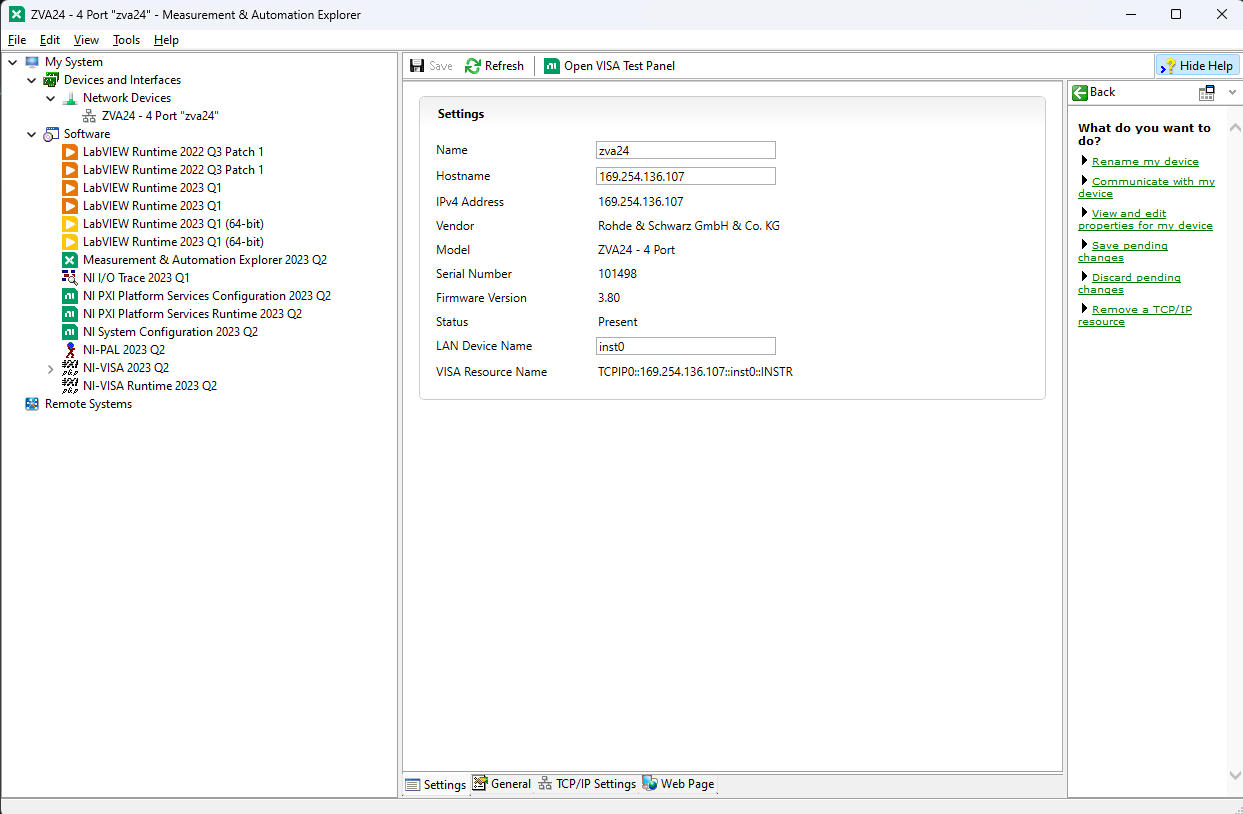
Enter the IP address of the ZVA-24 into the field "Hostname or IP Address." Use the IP address obtained from above.
- Validate Connection:
Use the "Validate" button to verify that the VISA connection can be successfully established. NI MAX will attempt to communicate with the instrument and confirm the connection.
- Open VISA Test Panel:
Once the connection is validated, right-click on the newly created resource under "Devices and Interfaces" and select "Open VISA Test Panel."
- Send IDN? Query:
In the VISA Test Panel, go to the "Input/Output" tab.
In the command box, type:
IDN?\n
And click "Query." This command queries the instrument for its identification string.
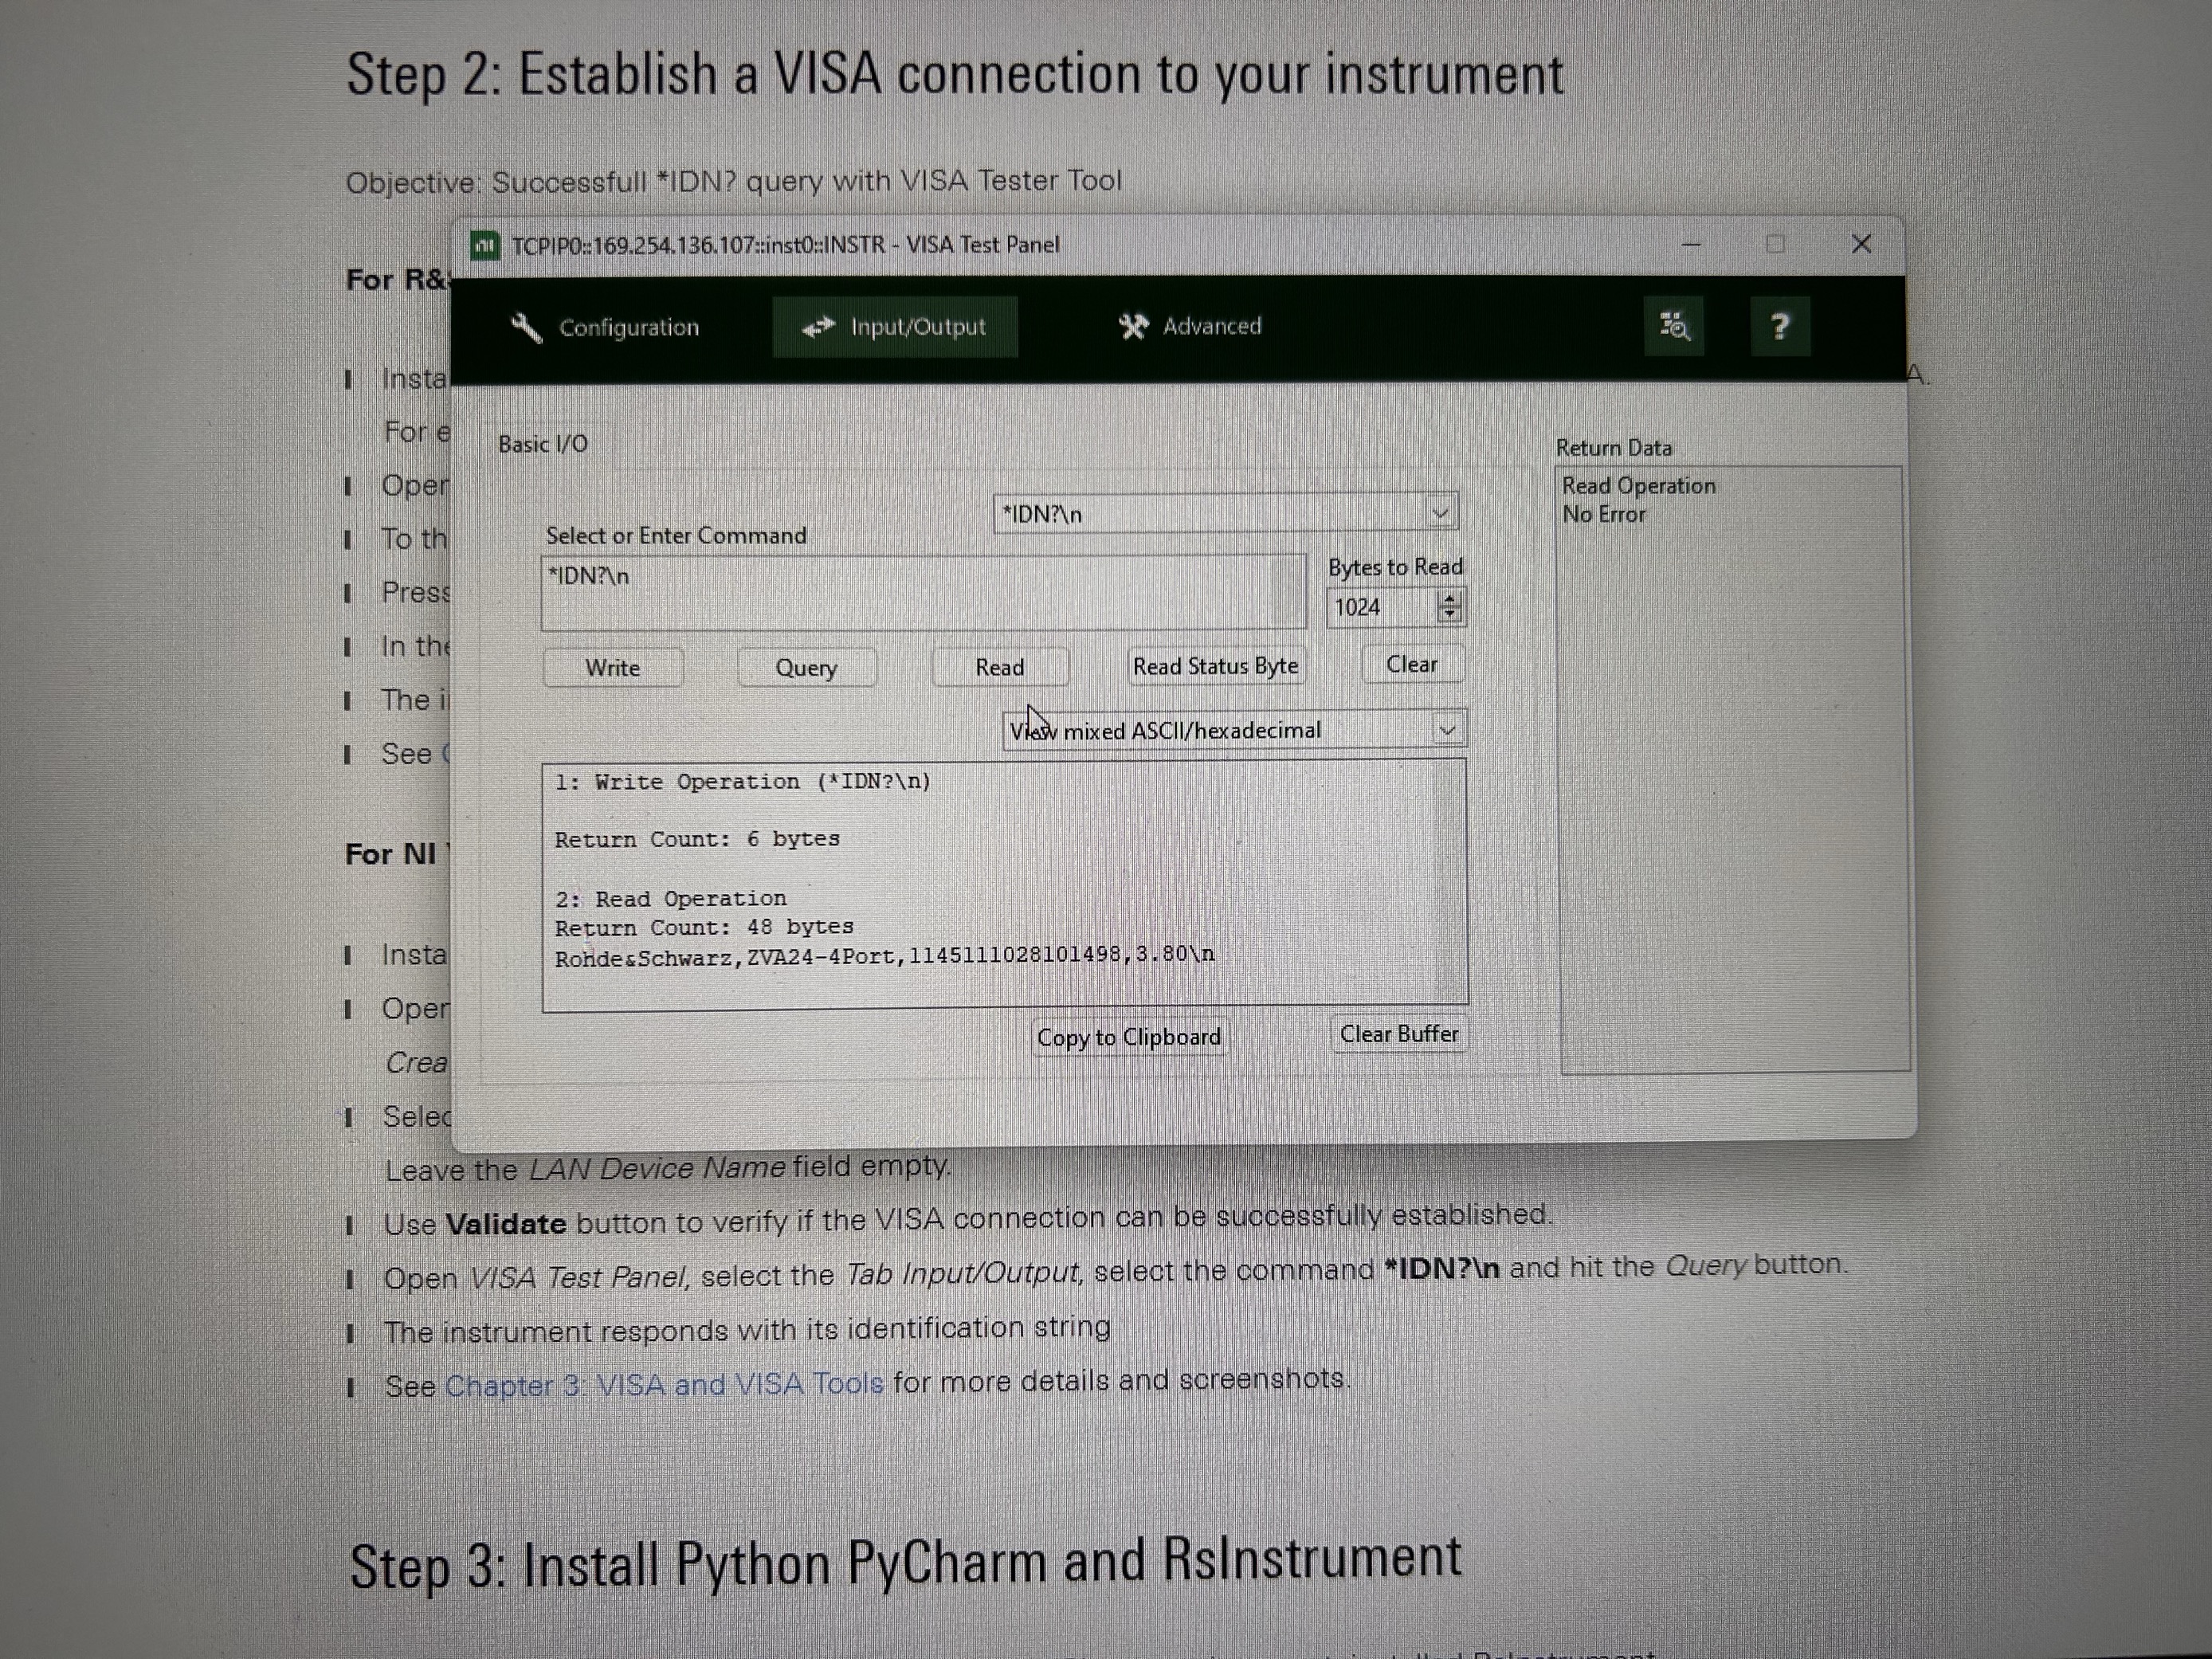
The instrument should respond with its identification string, confirming that the communication is established.
Verify IP Configuration:
Use the command prompt to verify the network settings by typing ipconfig. This will display the network configuration, including IP address, subnet mask, and gateway, ensuring the ZVA-24 is on the same network.
- Ping the Instrument: Use the command prompt to ping the instrument's IP address to ensure it is reachable. Type:
ping <instrument_IP_address>
on the host computer shell and check for a successful reply indicating connectivity.
| Before ping: | After ping: |
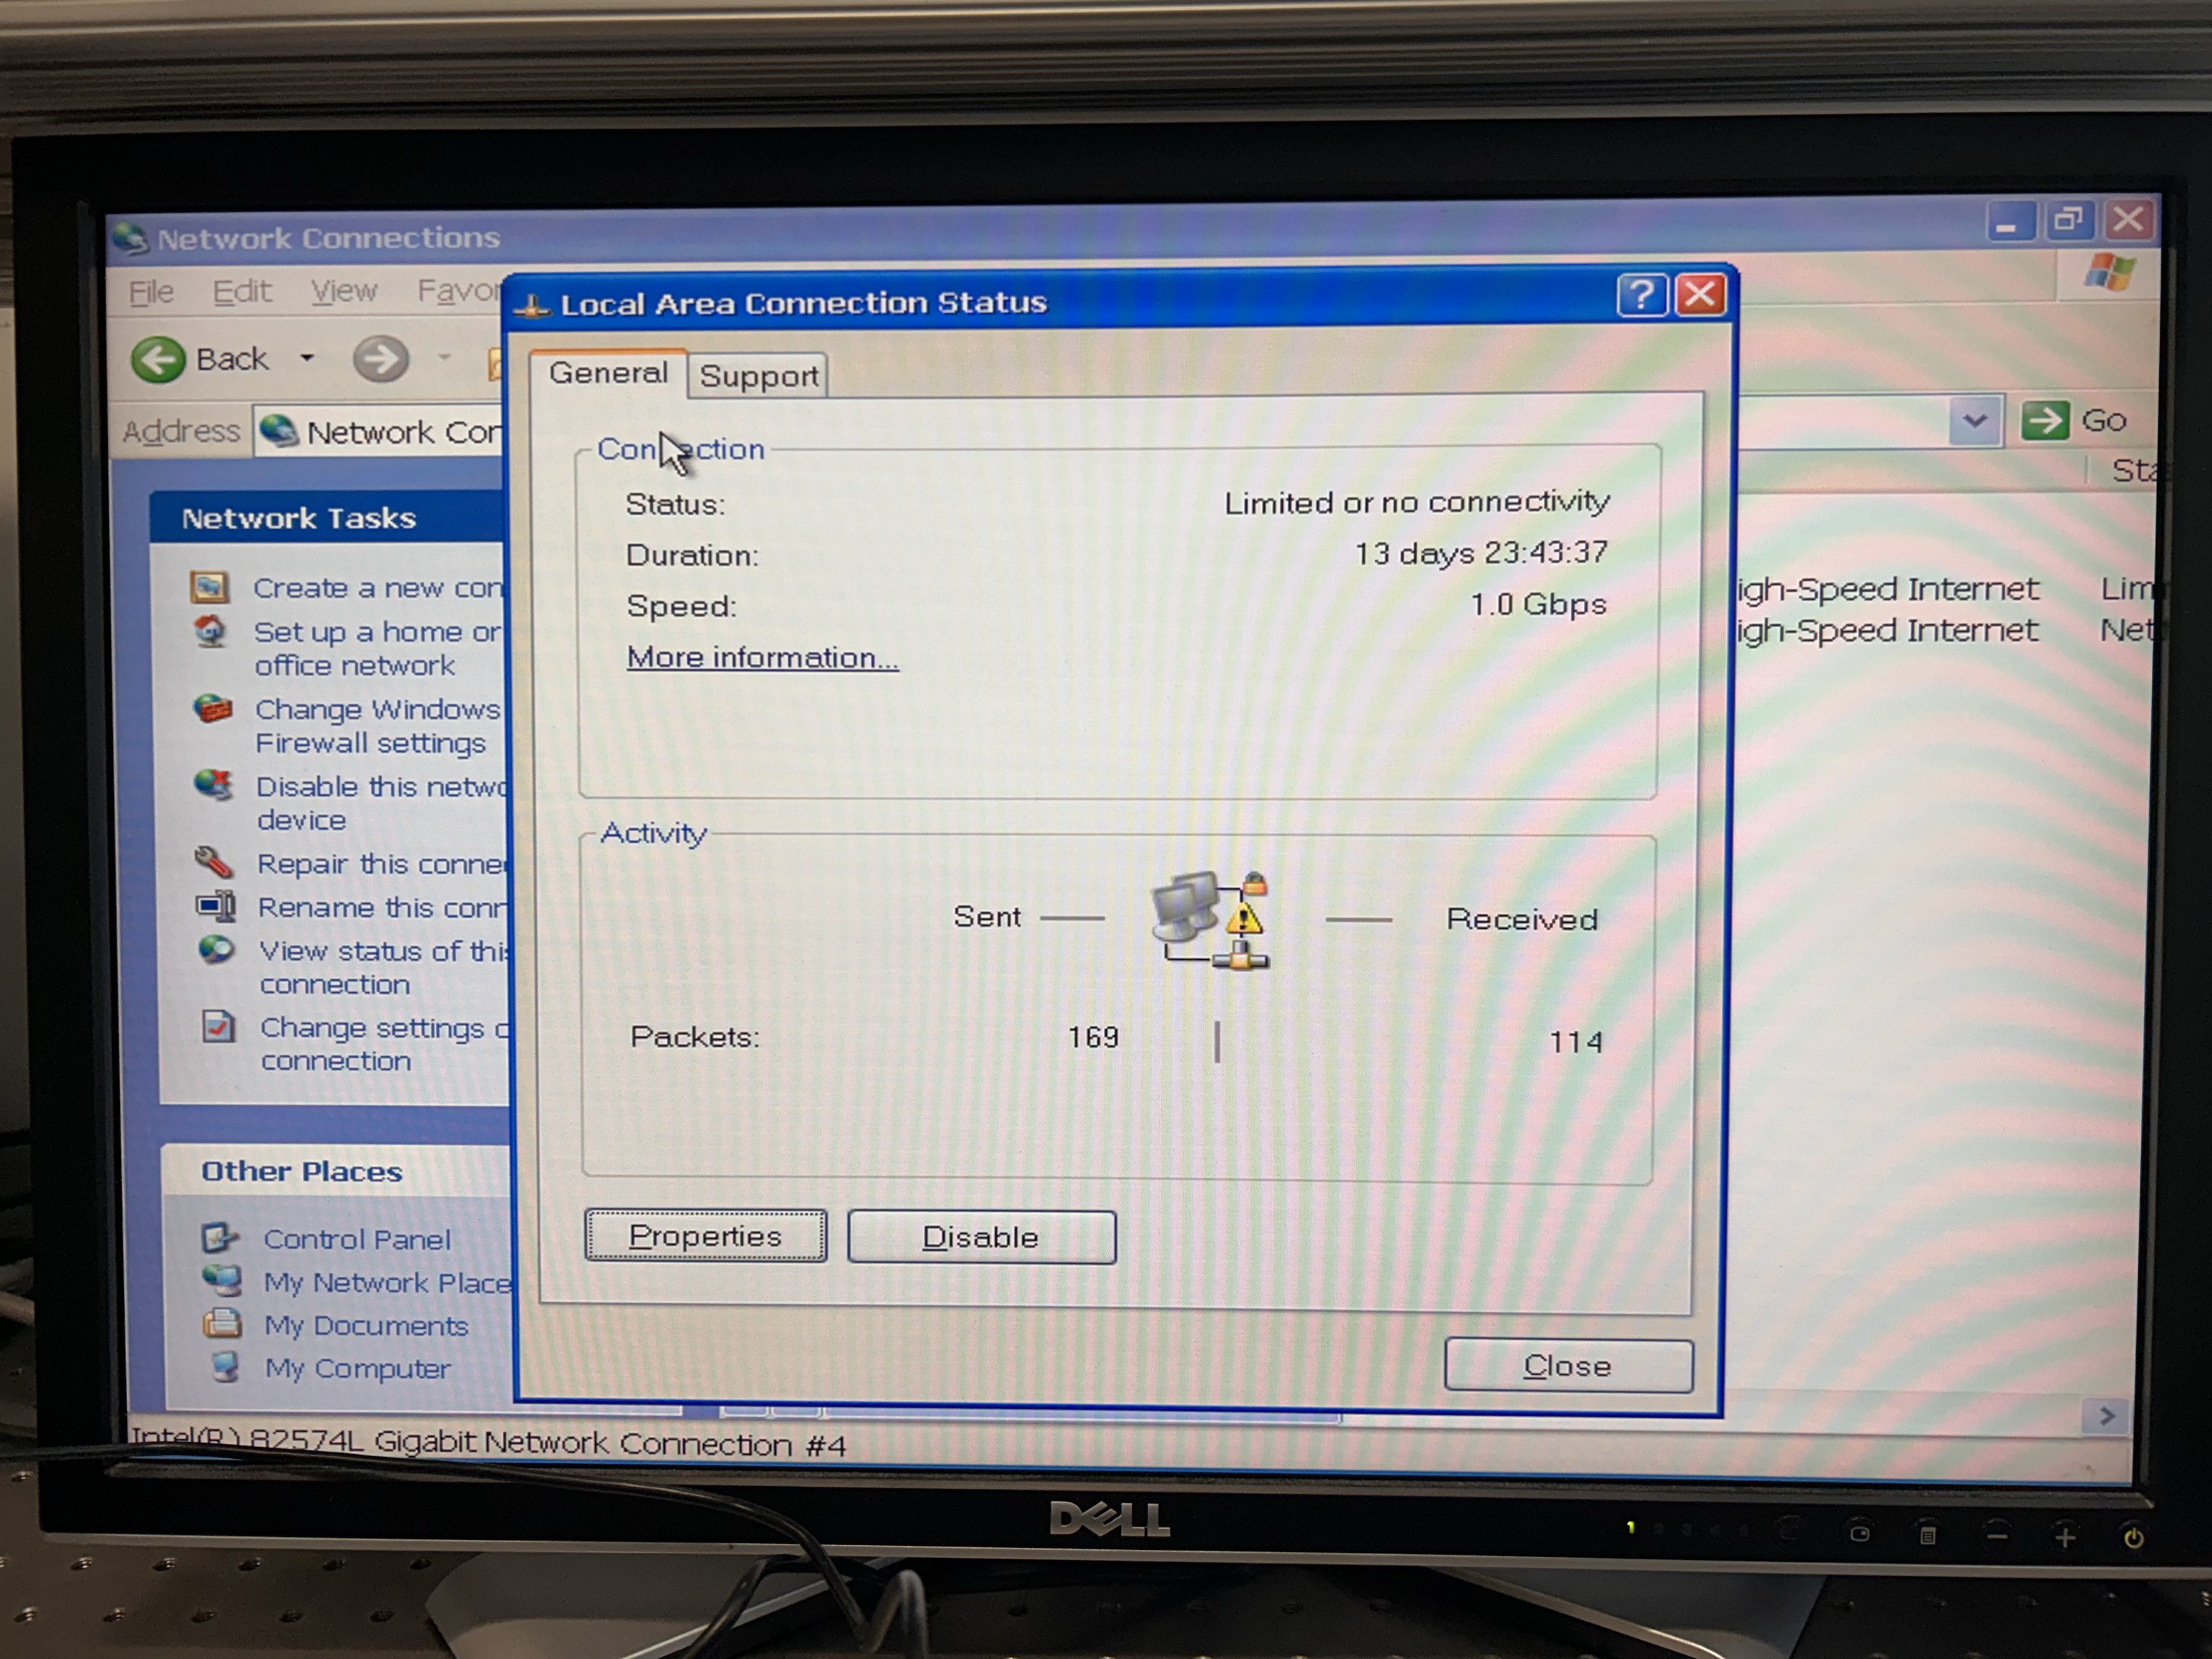 |  |
Software Configuration
Reading information using Python:
- Install the necessary packages in your Python environment by running the following command in your command prompt or terminal:
python -m pip install -U pyvisa numpy
- Install a VISA backend by running the following command in your command prompt or terminal:
python -m pip install -U pyvisa-py
- Once the packages are installed, you can import the required module in your Python script and start collecting data. For example:
import numpy as np
import zva as vna

frequencies, measurements, trace_definitions = vna.read_traces( address='TCPIP0::your-instrument-address::inst0::INSTR', num_sweeps=1, channels=[1] )
The read_traces function reads complex-valued trace data from the ZVA-24 VNA. You need to specify the address of the analyzer (e.g., XXXX0::ADDRESS::INSTR') and other parameters such as the number of sweeps and channels.
Python SnP Programming
Exporting Data and Plotting
- Data Export:
Using the Python script, you can export the trace data from the ZVA-24 into Touchstone files. This is done by running a Python script that reads the complex-valued trace data and saves it into the desired format. Be sure to install
scikitbefore proceeding:
import os
import numpy as np
import skrf as rf
import zva as vna
from RsInstrument.RsInstrument import RsInstrument

vna_address = 'TCPIP0::your-instrument-address::inst0::INSTR'
experiement_name = 'vna_test'

def init_vna(address=vna_address):
    instr = RsInstrument(address, True, False)

    idn = instr.query_str('*IDN?')
    print("****************************************\n")
    print(f"\nHello, I am: '{idn}'")
    print(f'RsInstrument driver version: {instr.driver_version}')
    print(f'Visa manufacturer: {instr.visa_manufacturer}')
    print(f'Instrument full name: {instr.full_instrument_model_name}')
    print(f'Instrument installed options: {",".join(instr.instrument_options)}')
    print("****************************************\n")

def save_touchstone(freqs=None, meas=None, trace_definitions=None, experiement_name=experiement_name):
    num_ports = int(np.sqrt(len(meas[0]) / len(freqs[0])))

    freqs = freqs[0]
    folder_path = os.getcwd()
    freq = rf.Frequency.from_f(freqs, unit='Hz')
    freq.unit = 'GHz'
    filename = 'snp_files'
    N = len(freq.f)
    os.makedirs(os.path.join(folder_path, filename), exist_ok=True)

    for inx, data in enumerate(meas[0]):
        S_para = np.array([[[s11,s12], [s21,s22]] for s11,s12,s21,s22 in zip(data[0],data[1],data[2],data[3])])

        touchstone_name = filename + f'_{experiement_name}_{inx+1:0{len(str(N))}d}'

        NW = rf.Network(s=S_para, frequency=freq, name = touchstone_name)
        NW.write_touchstone(filename = touchstone_name,
                            dir = os.path.join(folder_path, filename), skrf_comment=False)
        print("saved trace to", os.path.join(folder_path, filename, touchstone_name))

def grab_data(address=vna_address, sweeps=1, channels=[1]):
    frequencies, measurements, trace_definitions = vna.read_traces(address=address, num_sweeps=sweeps, channels=channels)

    return frequencies, measurements, trace_definitions

if __name__ == '__main__':
    init_vna()
    freqs, meas, trace_definitions = grab_data(sweeps=1, channels=[1])
    save_touchstone(freqs, meas, trace_definitions)
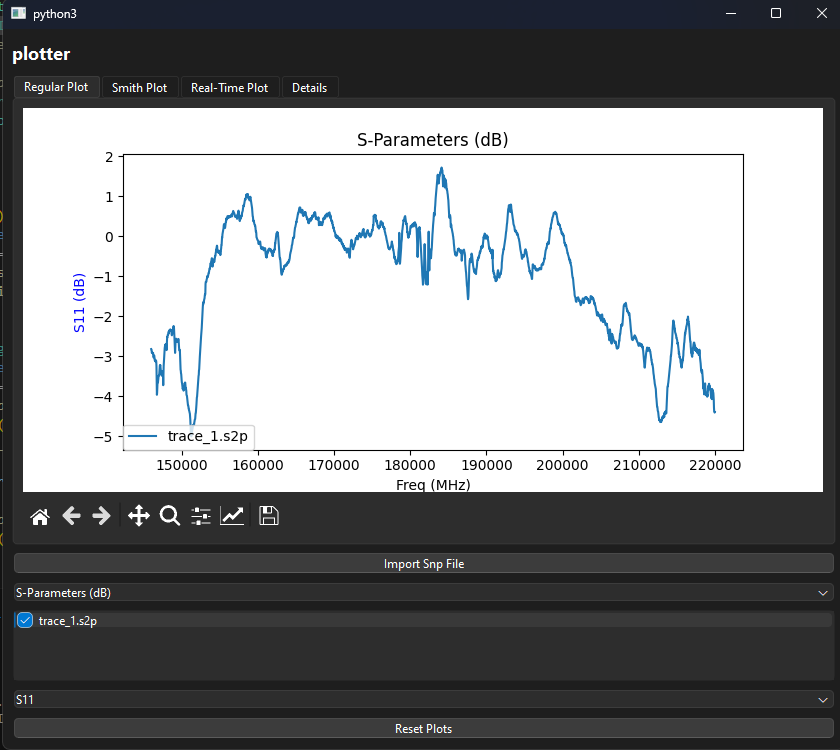
- Plotting Data:
After exporting the data, you can use plotting libraries such as
matplotlibin Python to visualize the S-parameter touchstone files:
Additional Resources
Refer to the following resources:
SCPI Python script for collecting trace data from R&S VNAs:
https://github.com/ZiadHatab/scpi-rohde-schwarz-vna
Rohde & Schwarz ZVA manual:
https://www.rohde-schwarz.com/manual/zva/
R&S VISA Application Note:
https://www.rohde-schwarz.com/us/applications/r-s-visa-application-note_56280-148812.html